What I did
- Research:
Scipy - Database:
PostgreSQL, PostGIS
Project Goals
This was an independent project in Socioeconomic Applications of GIS class. This research studies and analyzes people’s travel behavior across different demographic and socioeconomic groups. This analysis will present the mobility patterns for routine shopping, dining outside, primary care and recreational activities of population subgroups in terms of ethnicity and social-economic status in a Chicago metropolitan areas A total amount of 31,347 trips for routine shopping, restaurant dining, primary care and recreational activities in Chicago Metropolitan Area from more than 30,000 distinct individuals were extracted from a public travel tracker survey collected by the Chicago Metropolitan Agency for Planning (CMAP) in 2008
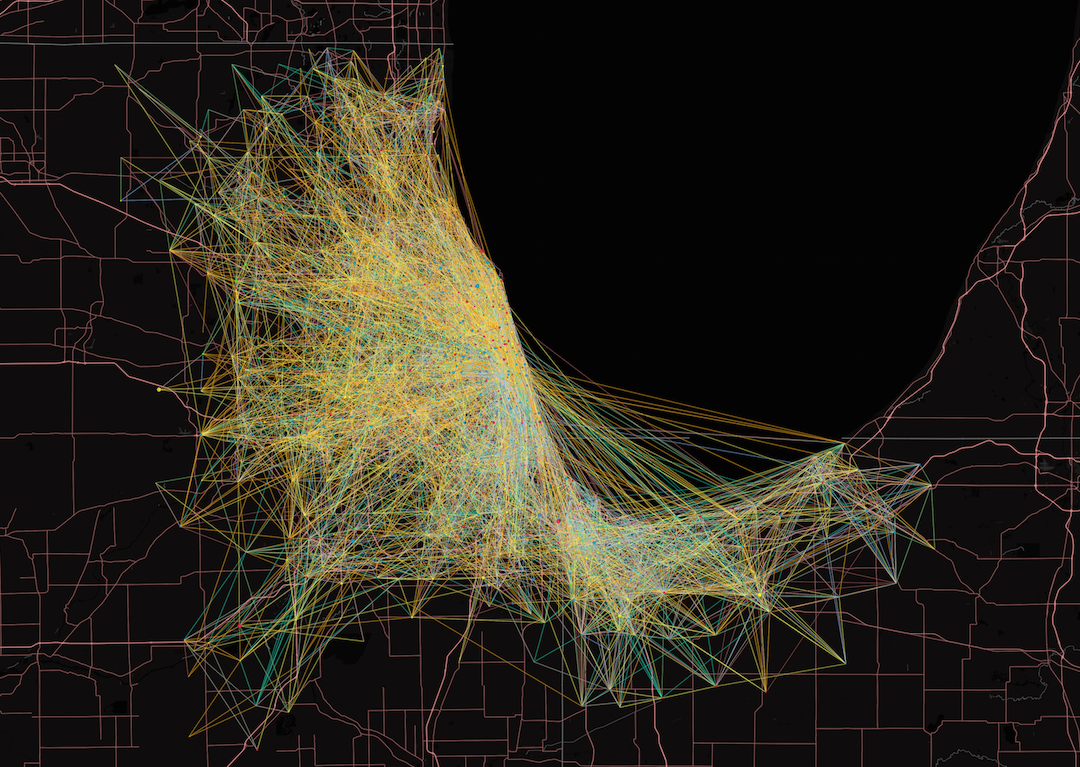
Map Design
I created a series of maps to observe travel pattern of people from different income and race groups. I used a black base map to show contrast of area and spatial acitivities.
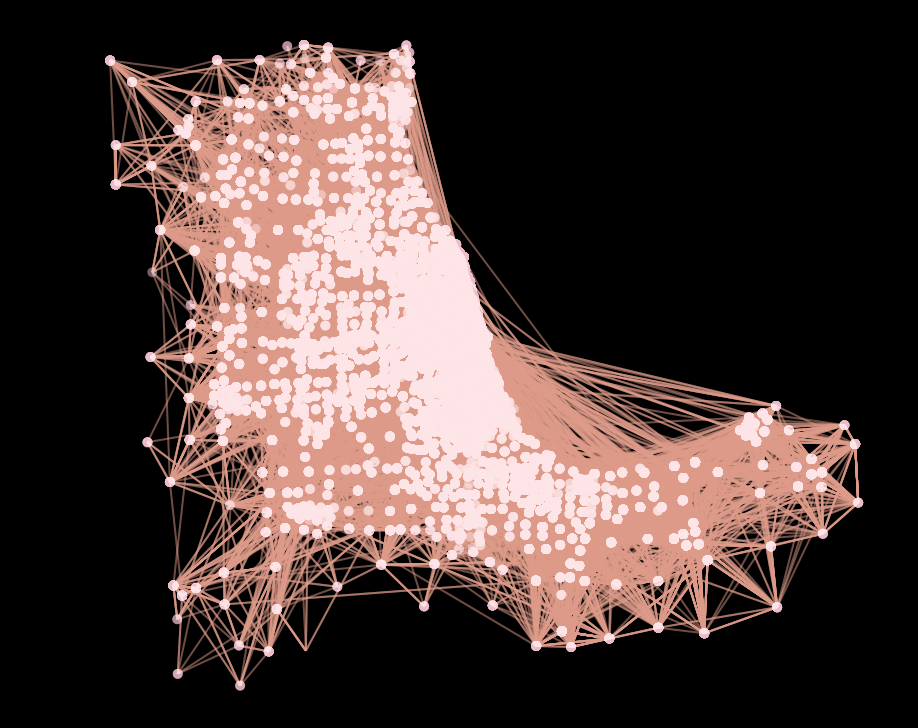
I used different color to visualize different activities, such as traveling to work, going to hospital, shopping, etc.
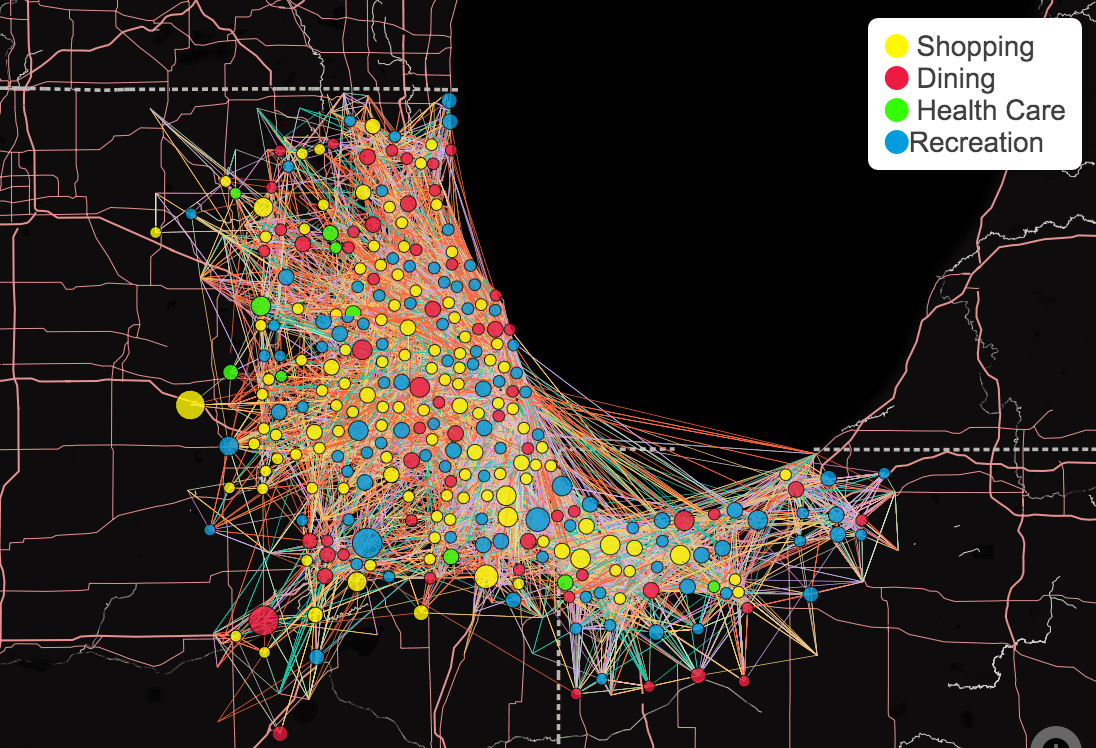
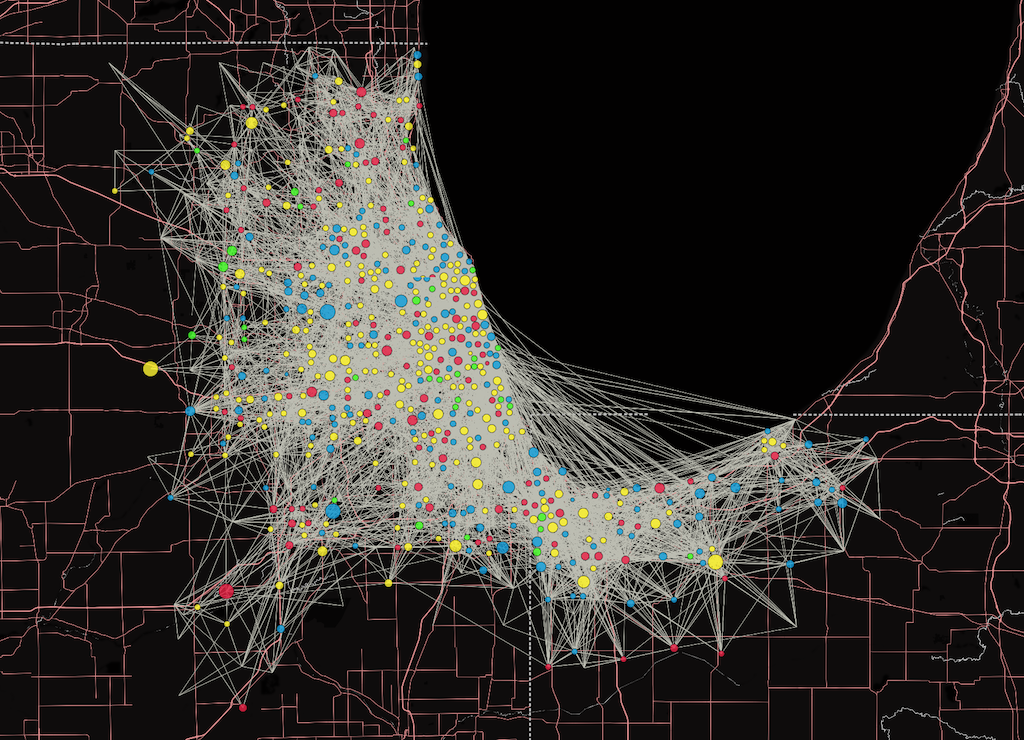
The points on the map showing the destination based on the types of activities. I would like to encode multivariate information in terms of how busy that place is, what kind of activities that people are doing at that place, and the location of that place. So, I used points to indicate the location of the place, color to differentiate the activities, and size to show how much people go to visit the site in a day.
Data Processing
I downloaded the raw survey data in MS Access. Then I reorganized and converted data into
Postgres
Database. The dataset is categorized into two different subgroups by ethnicity and
socio-economic
status. In this research, the ethnicity is divided into four groups of races which are White,
African
American, Asian and Hispanic. For Socio-economic status analysis, this subgroup is categorized
into
seven subgroups based on median household income including
1 - Less than $20,000
2 - $20,000 to $34,999
3 - $35,000 to $49,999
4 - $50,000 to $59,999
5 - $60,000 to $74,999
6 - $75,000 to $99,999
7 - More than $100,000
In order to calculate travel time for each trip, we have to generate the pairs of x,y coordinate
between
household locations as the origins and the travel destinations and mode of transportation in
order
to
calculate the travel time of each trip. After data was fetching from the database, it will be
computed
through Google Distance Matrix API in order to get the travel time based on geographical
coordinates
and
mode of transportation.
Data Analysis
In order to study the different in travel patterns for four activities
including routine
shopping, restaurant dining,
primary care and recreational activities among subpopulations.
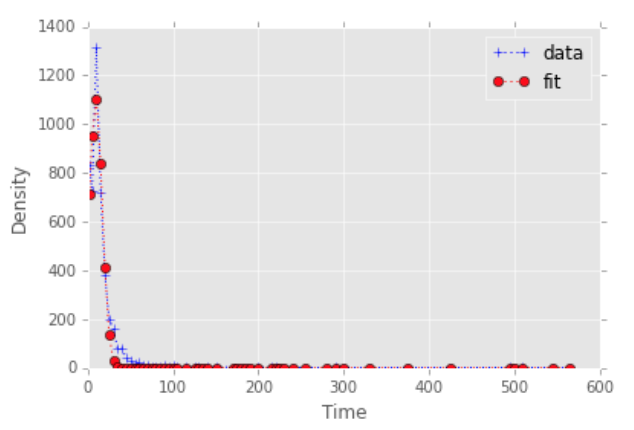
First, we have to find the fitness distance decay functions that
can help us address the changes or declination in the interaction effect
between physical or socioeconomic objects decline with distance between them.
For this research, five distance-decay functions ,including Gaussian, Power,
Exponential,
Polynomial and Logarithm, are used to model the travel pattern of each subgroup
and compared with one another. The model with the highest pseudo-R2 is will be selected
as the best fitting model. All the parameters are estimated using the non-linear
least squares estimator. For more information about distance decay effect can be found
at
Quantitative
Methods and Socio-Economic Applications in GIS book by Dr. Fahui Wang.
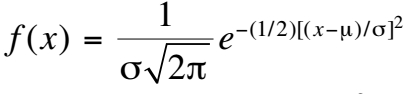
As a result, The Gaussian function persistently produced large pseudo-R2 than Power,
Exponential, Polynomial and Logarithm acrid all population subgroups.
This function is expressed as:
Results
After analyzing results of all subgroup travel patterns with Gaussian function, the results
we got from each subgroup based on distance decay effects (ß) are as the following.
For ethnicity analysis, the travel time that each ethnic spend for their trips various from
activities. To illustrate this, Asian spent more travel time on dining. African American
spent more time on shopping and health care, while Hispanic tended to focus on recreation.
Moreover, Asian got the highest distance decay effect among four activities.
For income analysis, the travel time that each income spend for their trips are also
various. However, people whose had the lowest income spent more travel time on Health Care
and Shopping, and the highest income spend more time for relaxing activities such as
recreation and dining. These two sub-income groups also had the highest distance decay
effect for most of activities.
Reflection
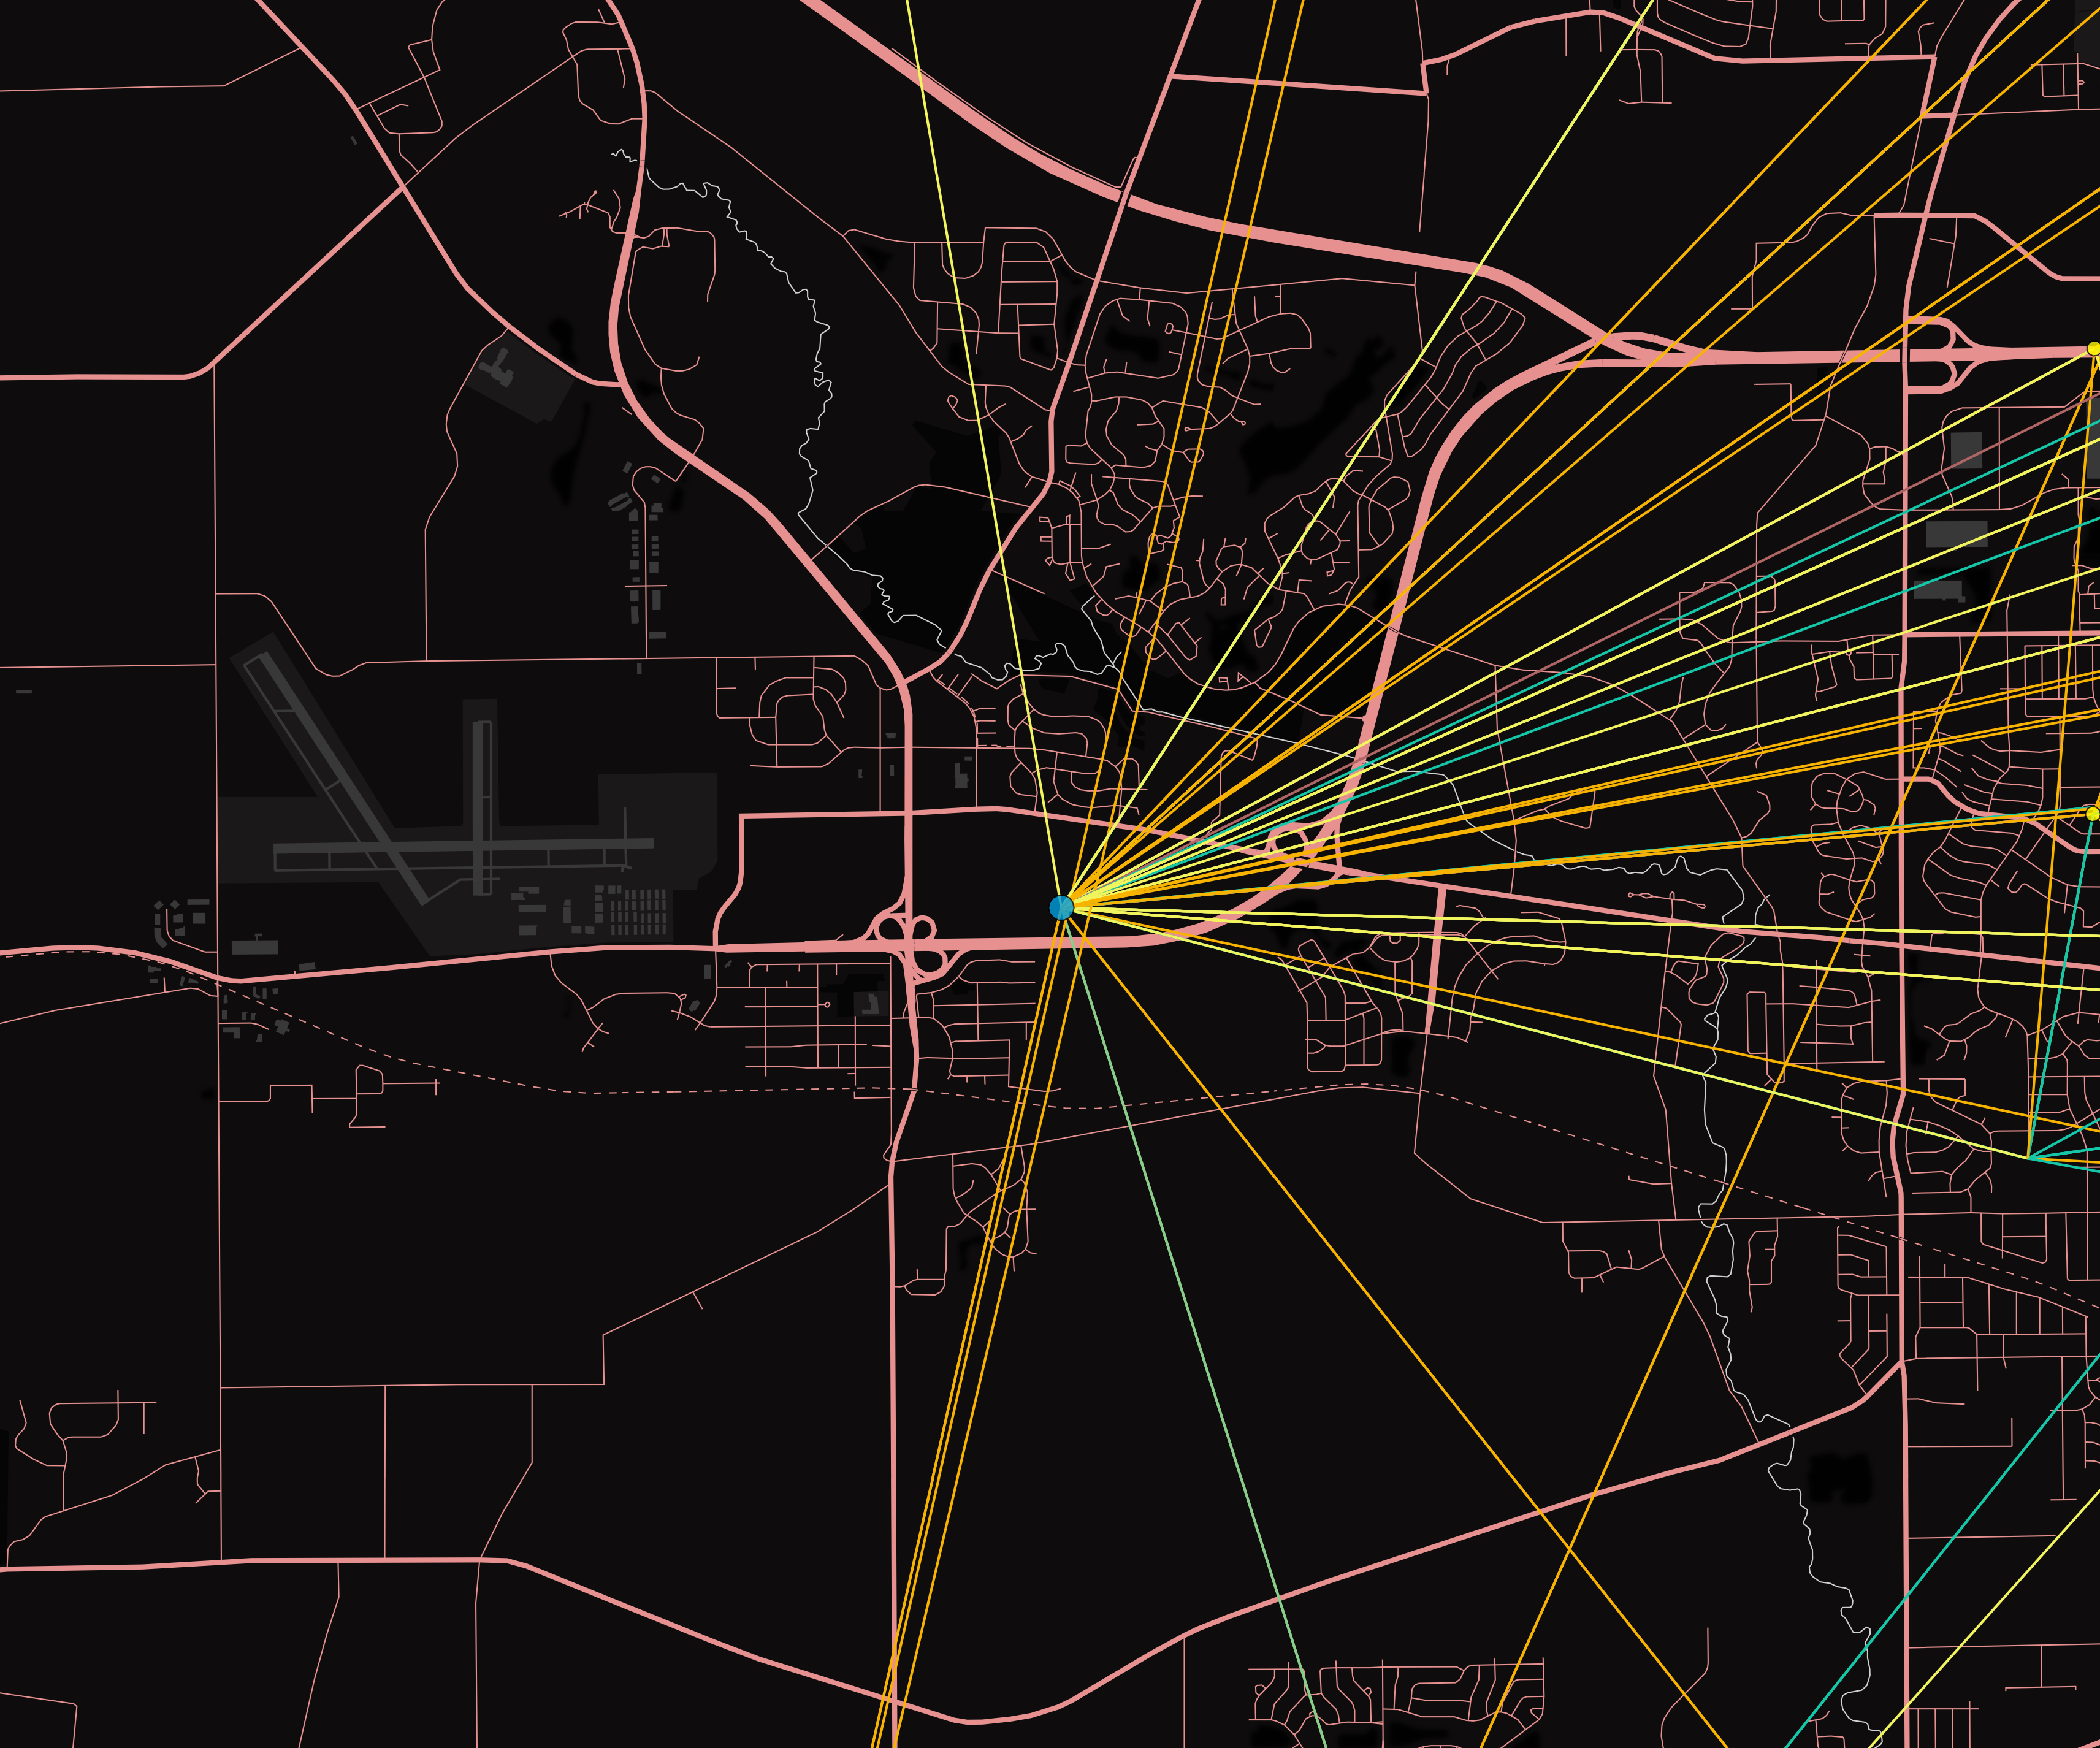
- Do not assume where would people go for their trips especially for shopping. I thought people would go to downtown or big mall for shopping. There were a lot of reversing commuters that people who lived in the cities went to shop and eat in suburban areas.
- Due to a small number of records for some subpopulation groups, the distance decay factors for those groups might not be sufficient to reflect their actual travel patterns.