Trips - TAZ
Trade Area Zone Analytics
What I did
- Role:
UX Designer, Developer - Date:
July 2017 - September 2017 - Prototyping:
Sketch - Coding:
Javascript, HTML, CSS, Meteor
As one of the most profitable products from INRIX, Trips provides analysis of users’ travel pattern, including where they start, stop, and all the points they drop by inbetween. INRIX just announced the new Trip APIs that allow customers (companies who purchased the data from INRIX) to download people’s mobility patterns across the world.
For this project, my main contributions were:
- Brainstorming potential features of Trips
- Creating possible persona according to potential feature of Trips
- Designing prototypes
- Implementing using Javascript, Python, and Postgress
Design Process.
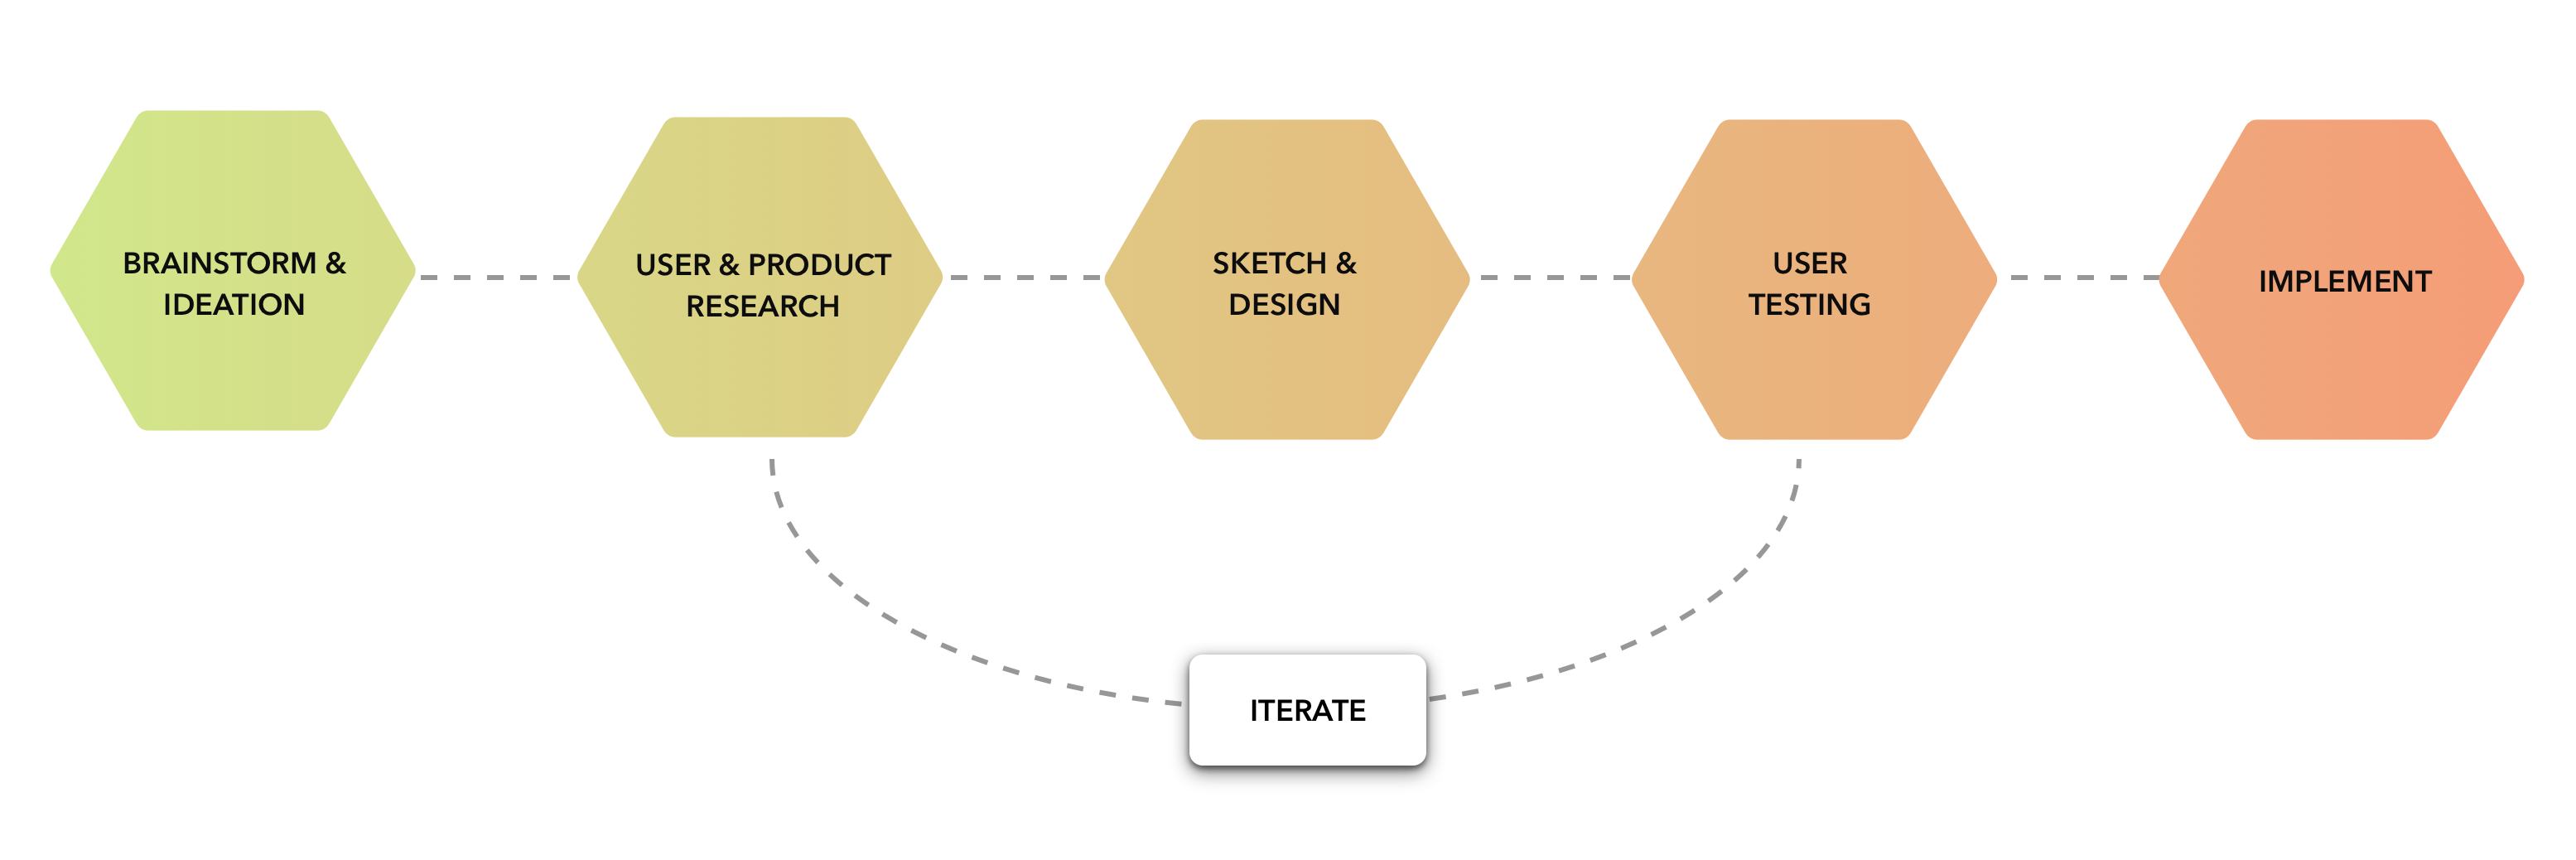
Brainstorm & Ideation.
As a intern, I got instruction from my supervisor to “aim for a new feature that they might not have before to show how Trips can utlize as a new innovative method to help users understanding their cities”. So I started with understanding all Trips datasets and existing features. After that, I brainstormed and sketched potential features to share with supervisors and teammates. The last part was scoping the ideas down and making it consistent with company’s branding and customer’s expectations.

After looking at the data, I developed 2 categories for existing data:
- Essential data. which provides essential information
- Supporting element. Users might not need to see at first glance, but they might want to use this information for further analysis.
Then, I analyzed all existing features to find the gap in exiting application and opportunities for a new potential feature. I came up with three ideas for the project as following:
-
Trade Area Zone
It's a location analysis feature that helps analyze and visualize the store's markets. When a specific store A is chosen, Trip will collect all the trips that stop at the store A, letting our customers(companies who purchased products from INRIX) know where their customers are from, and where their potential customers might be. It can assist customer in terms of analyzing their existing market coverage areas, provide insightful information for a new site selection and market potential, and conducting a competitor analysis. -
Traffic Hot Spot
This feature will provide a traffic hot spot in the cities during specific time of days. It can help provide essential location for billboard advertisement's site selection. -
Traffic Behavior Analysis
This feature will help us understand people's travel patterns and their mobility in the area. and provide the insight to find the potential business, market, or new store locations.

Customer and Product Research.
After presenting my ideas to my supervisor, the next step was to discuss the idea with a sale department manager and a technical project manager to understand the company’s identity, customers’ needs, and project milestone. After the brainstorming session, we decided to emphasize on the company's principle which is 4W “WHO (who are the customers) WHAT (what do they want) WHEN (What time of the day) WHERE (Where are they come from) ” and pursue the Trade Area Zone features that can help enterprise have a better understanding of their existing customers and be able to find new potential stores' locations. So, the next step was to conduct competitive analysis to understand what products were available in the market and how could our Trade Area Zonedo to attract enterprise customers.
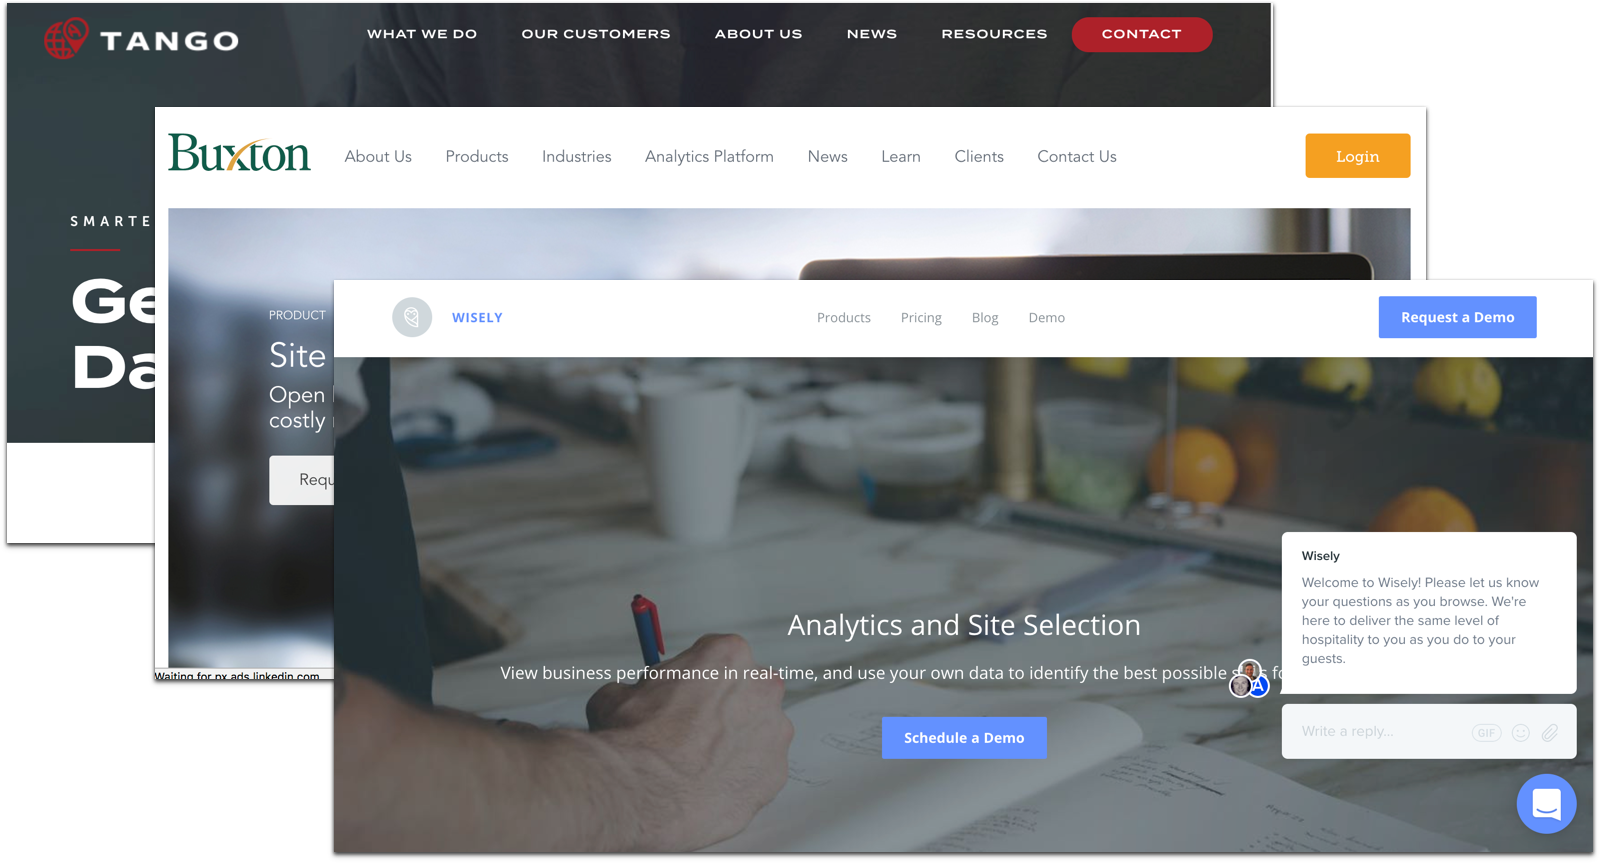
I conducted a competitor analysis to understand the current trends and existing features of Trade Area Zone features. So, I could find opportunities for our products to attract the targeted customers. I checked out Eastside, Tango analytics, and Buxton Consulting. Then, I identified the most common features that every platform had and identified the advantages and strength of our application that will make it rise in the market.
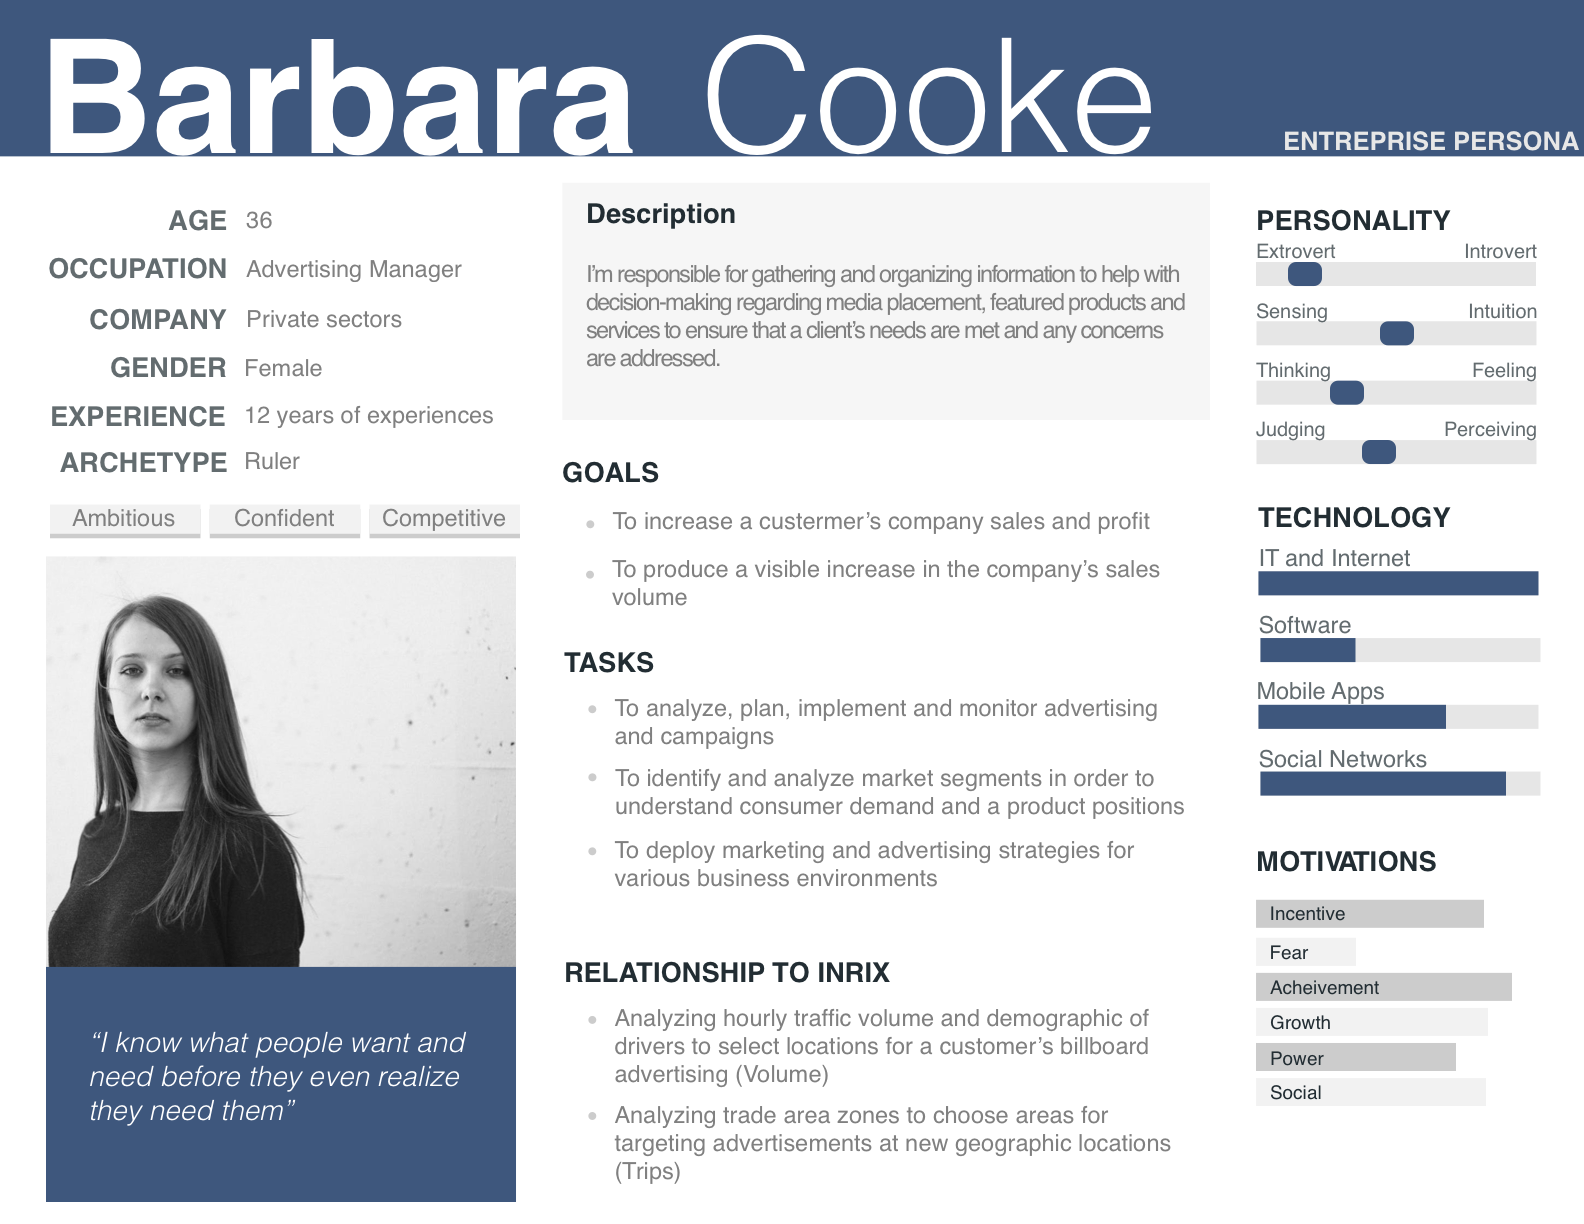
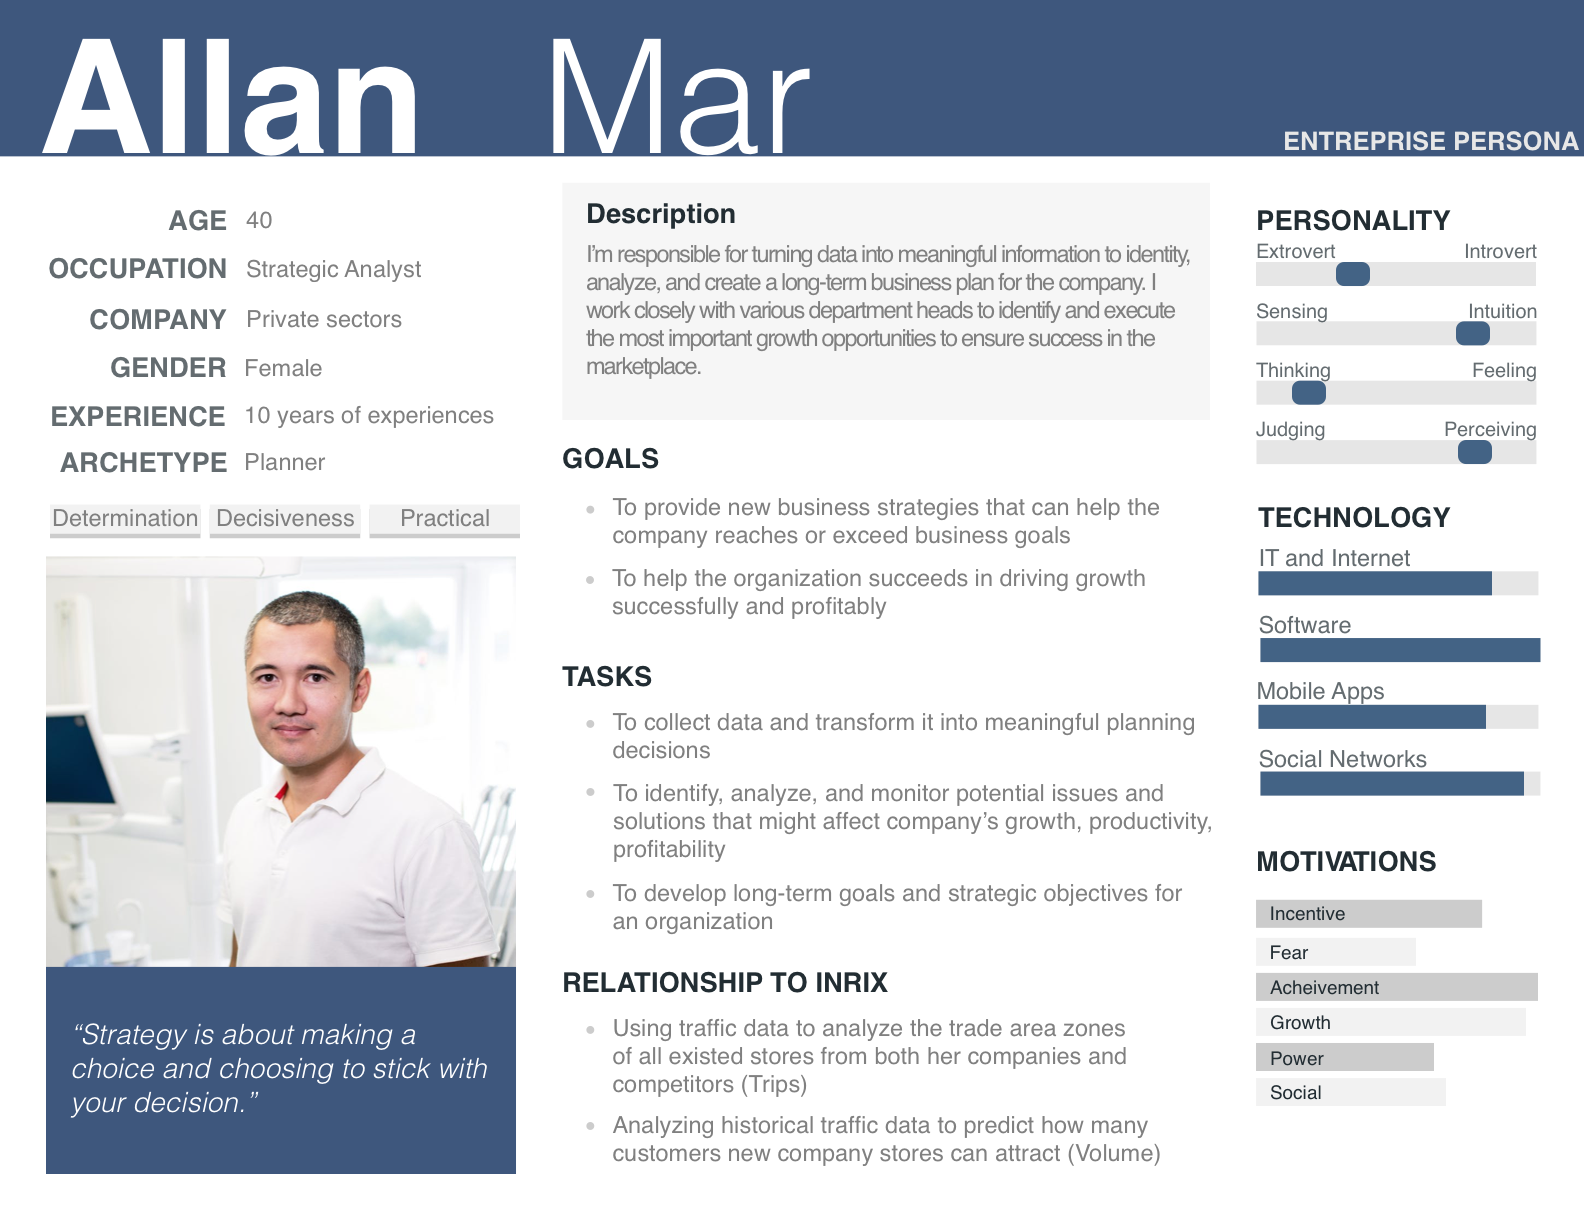
Creating user persona.
After collecting all essential information, I designed the users persona to scope down and focus on the product direction and INRIX’s Branding. The information from users persona came from user research and INRIX’s customer profiles.
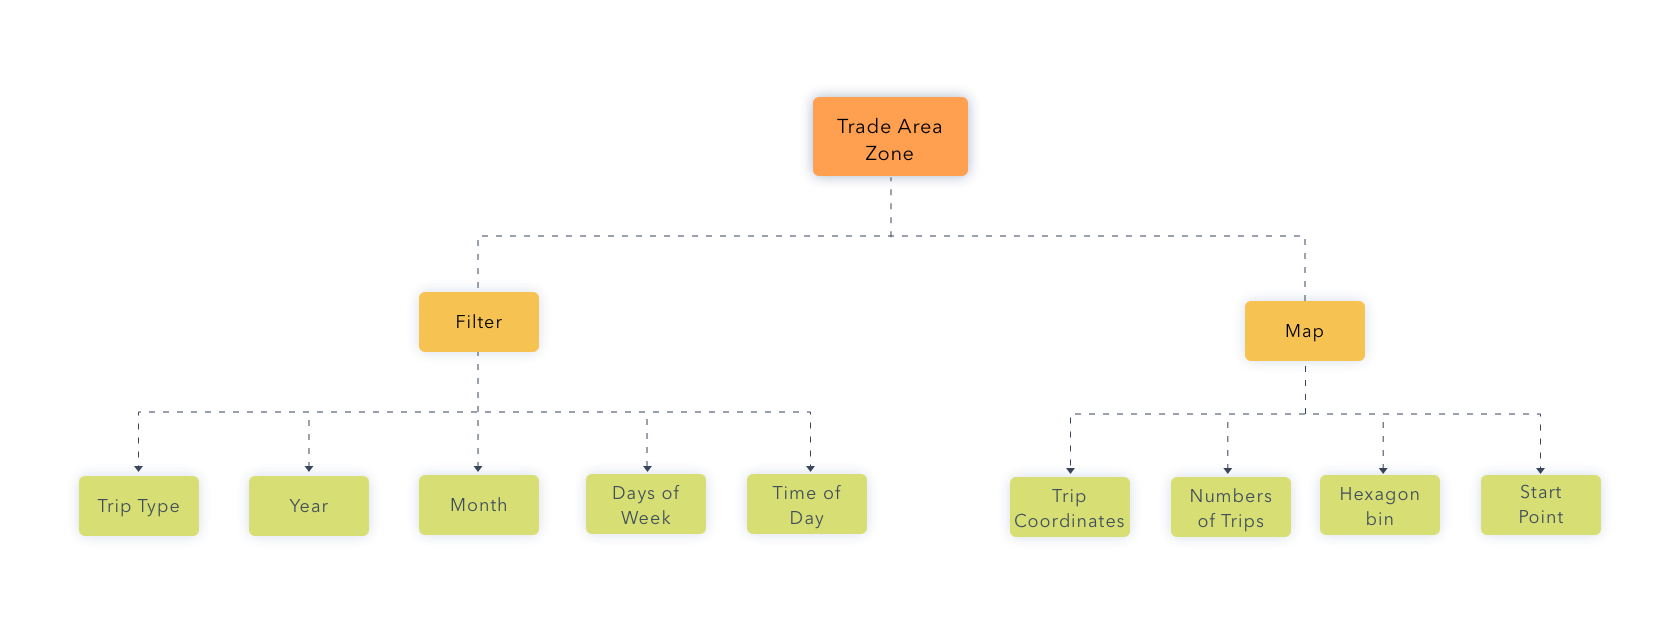
Information Architecture.
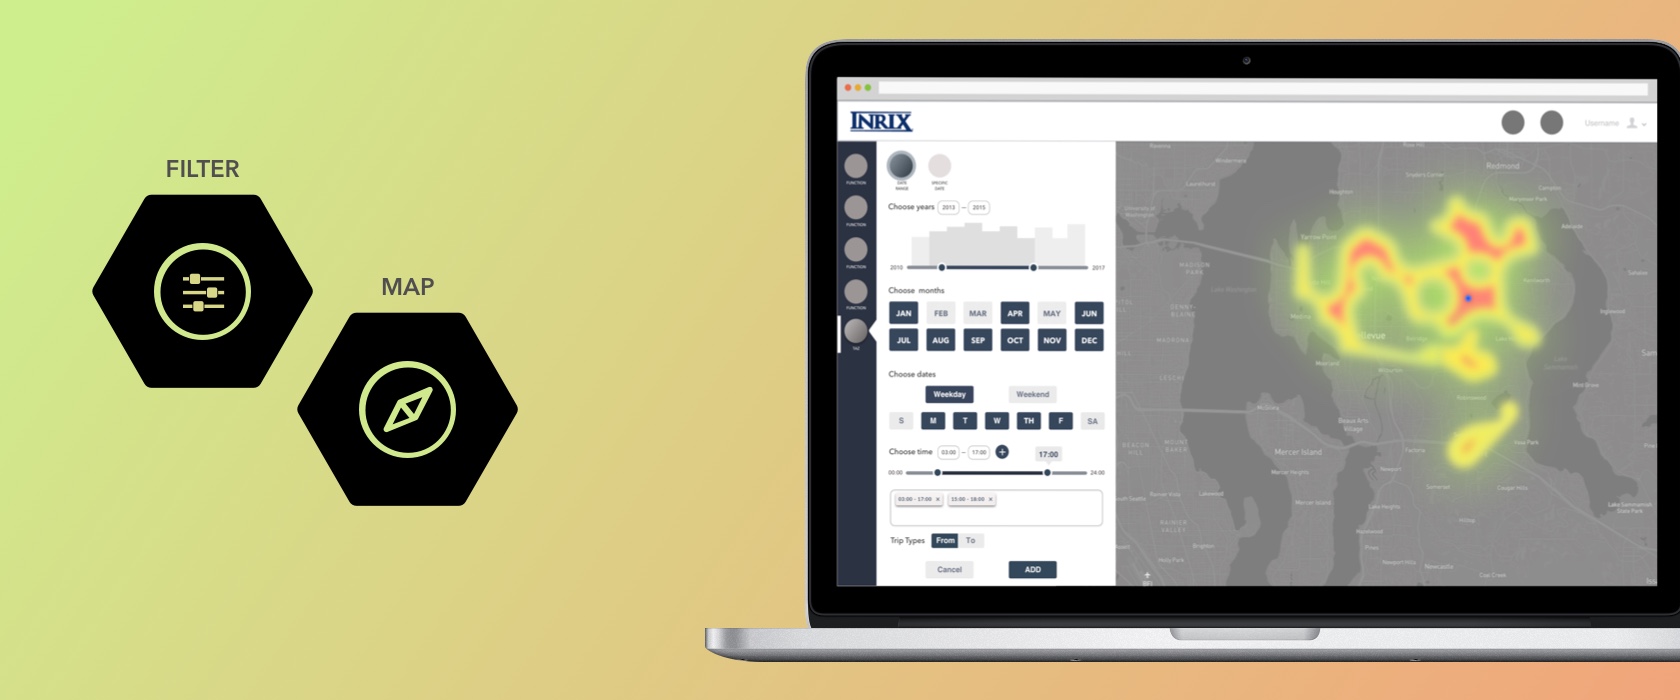
The main components of the Trade Area Zone would definitely be the map component that would work as a canvas for a trip visualization. Another essential supporting feature was a filter function that allows users to customize data granularity and filter specific date/time that they want.
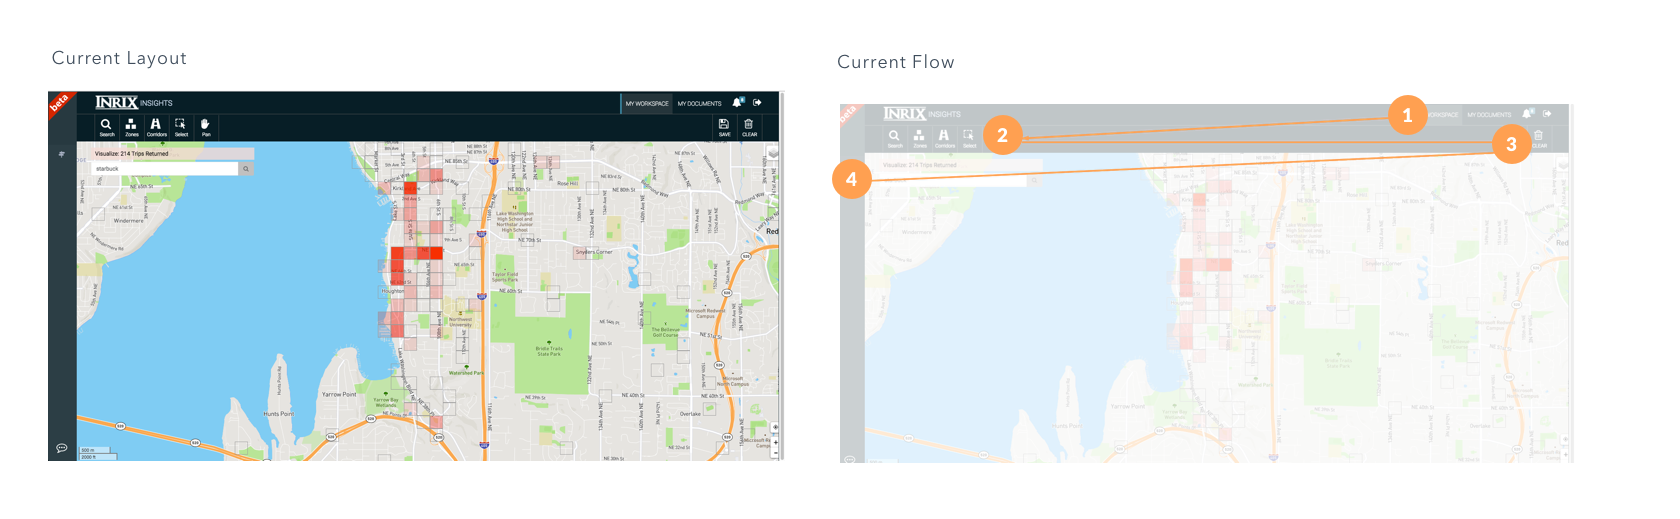
Designing application behavior flow.
Before designing the new features, I stepped back and looked at the current behavior flow to address existing issues, to improve users' experience. The current behavior flow of the existing trip application is quite hectic. Users had to start from the upper right corner to the left and right and left.
UI and Component Design.
Map Component
The map feature is the main component and canvas for this geovisualization feature. It needs to provide the store’s market area to help our customer understand and analyze their existing market coverage. In order to display the market network, we analyzed where their customers come from. It's also essential to provide insight information of customers' travel and behavior patterns by analyzing their travel activities after dropping by at the store to discover the behavior patterns and business opportunities. In terms of visualization, Trade Area Zone should display the actual points of customers' locations and also the density distribution of the trips journey to understand and have a better spatial sense of where exactly customers came from and where are the store's marker coverage areas. The reasons to have different kind of spatial features (point and polygon) because they provided the different sense of data granularity and spatial information between exact locations and density distribution. The dot distribution could provide more accurate information with higher data granularity. Whereas, the density distribution can provide a better sense of comparison because it provided area boundaries.
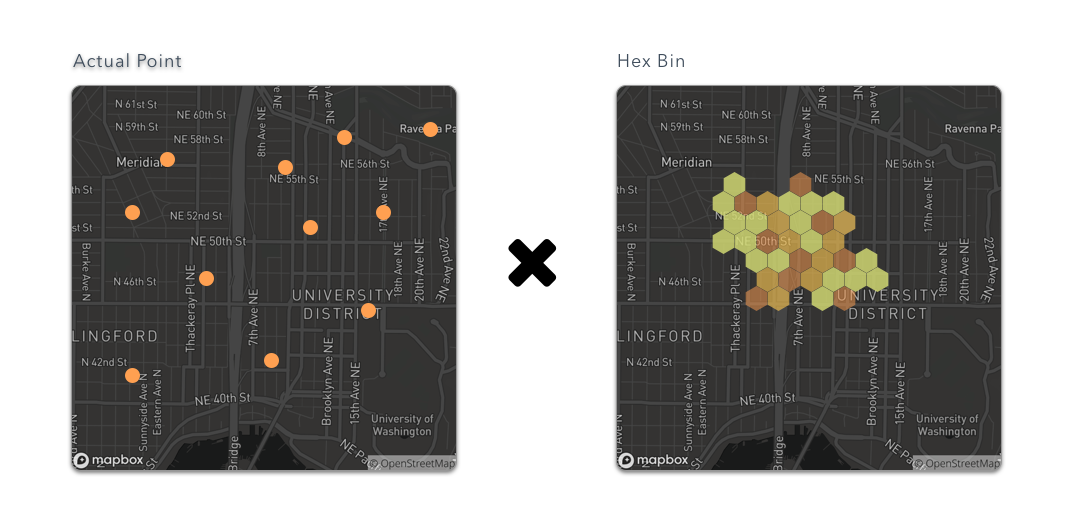
I decided to use Hexagonal binning or hexbin to show the density distribution. The reason being was based on Central Place Theory from Walter Christaller, hexagonal shape can better economically and geographically represent the market areas. Here are the supporting reasons.
- Circles are equidistant from center to edge, but they overlap or leave gaps.
- Squares nest together without gaps, but their sides are not equidistant from the center.
- Geographers use hexagons to depict the market area of a good or service, because hexagons offer a compromise between geometric properties of circles and squares.
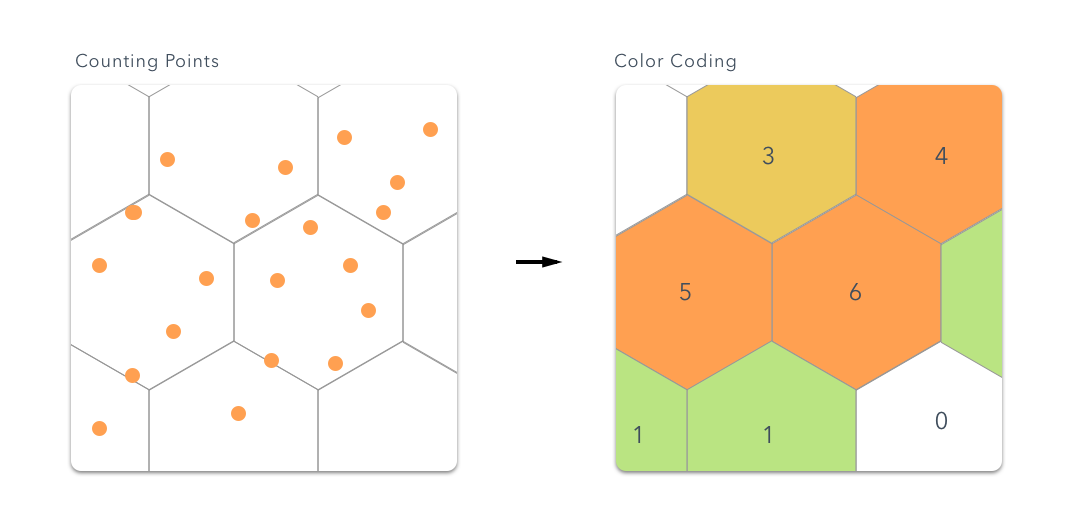
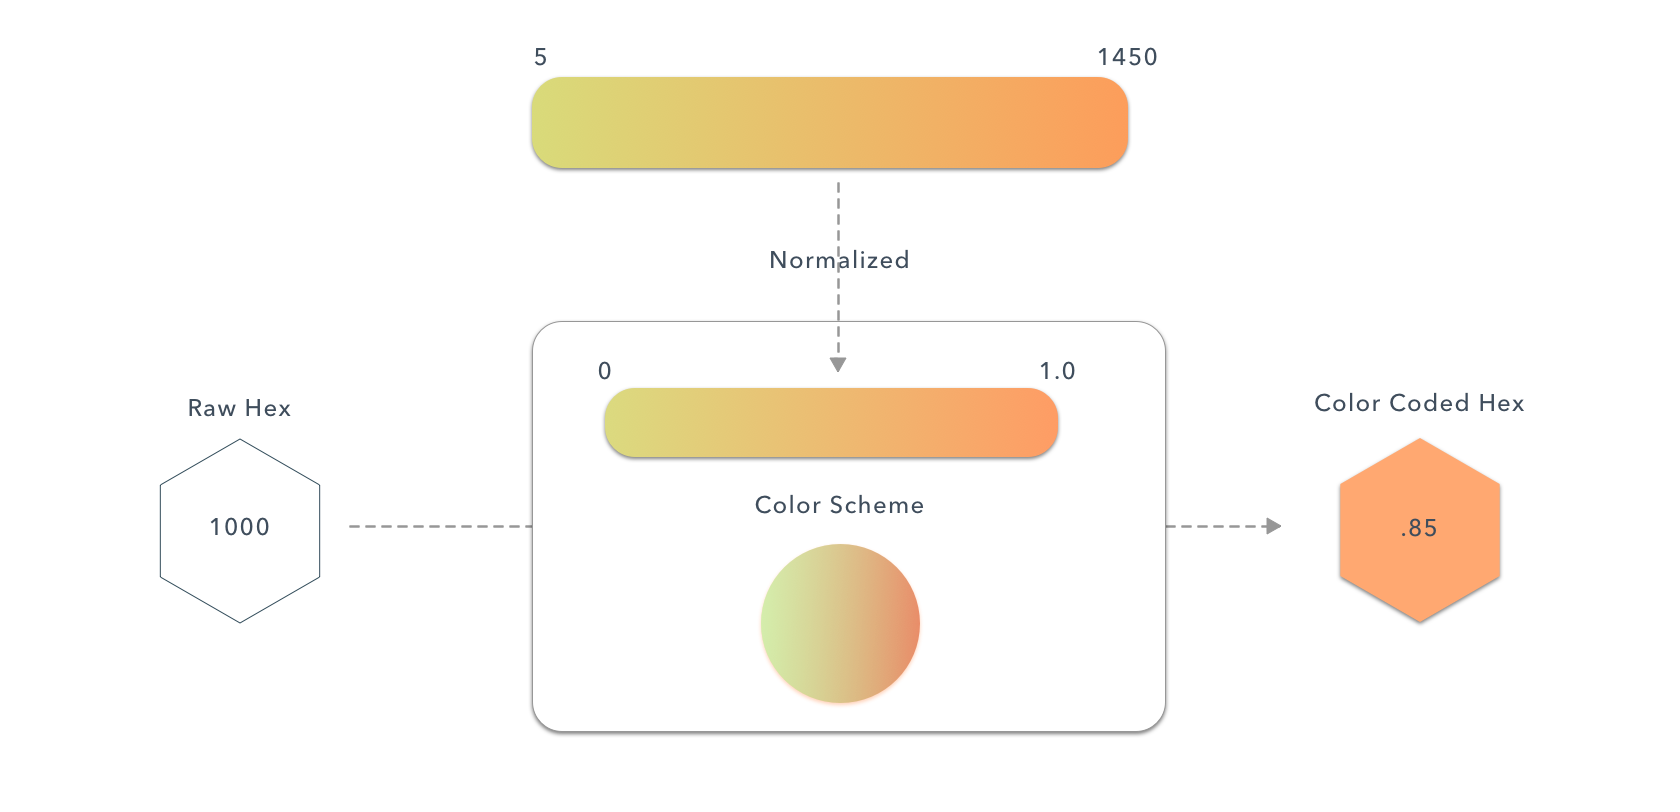
In order to choose the break points for the value and right color for travel pattern visualization in each hex bin, I decided to follow the frequency density by normalizing the actual value in the dataset (number of points in the hexagon) to 0 - 0.1. Then, I created the color interpolation of color palette (blue - red, green - red) to visualize the choropleth density map based on the position of the value (where was the data located from 0 - 0.1).
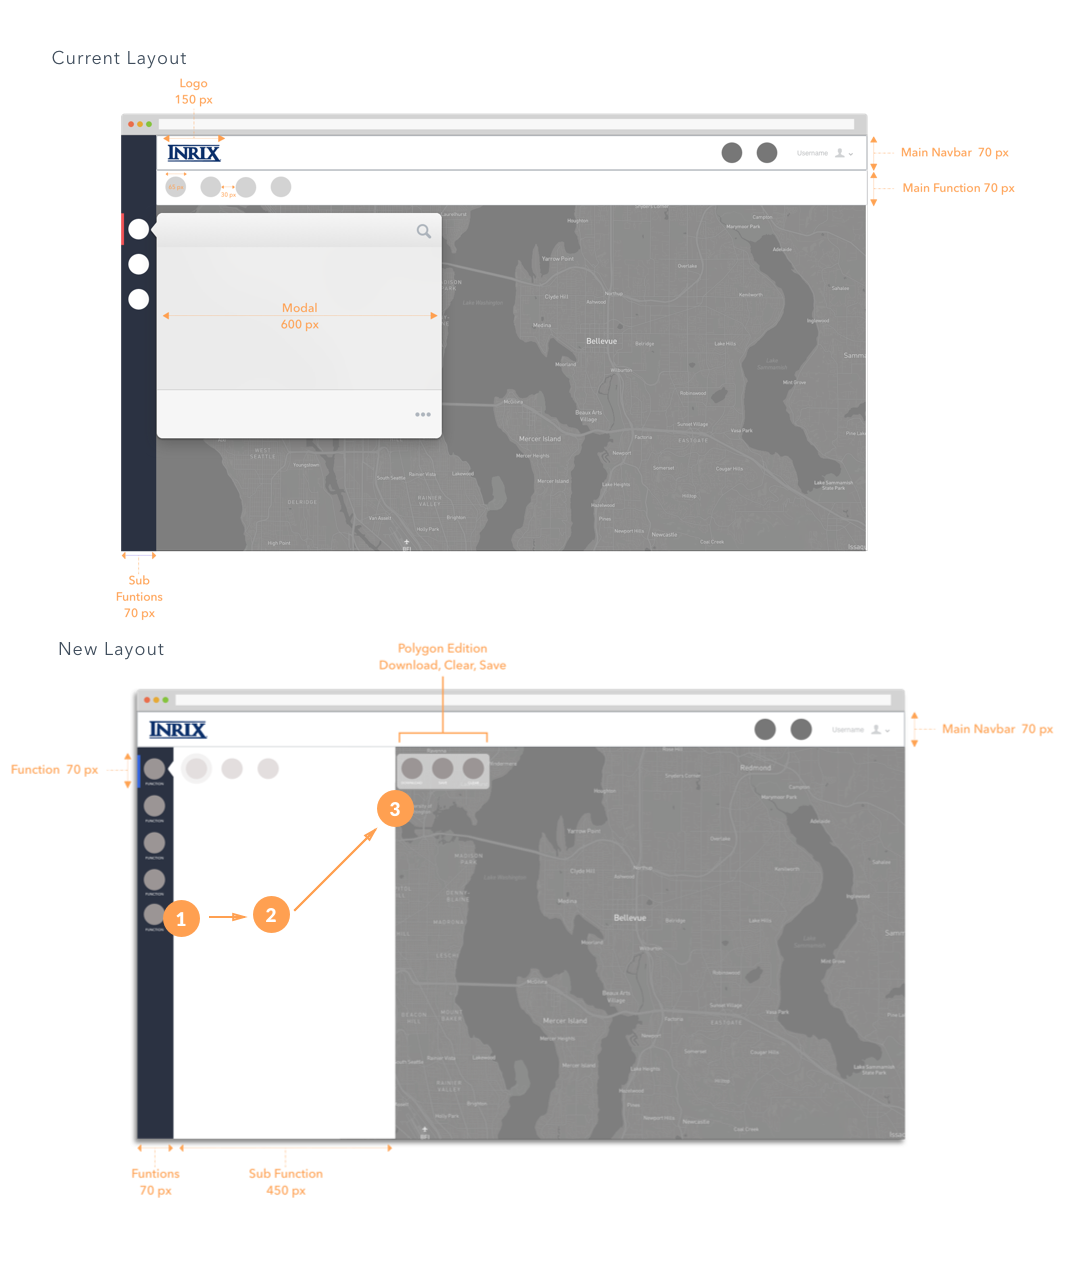
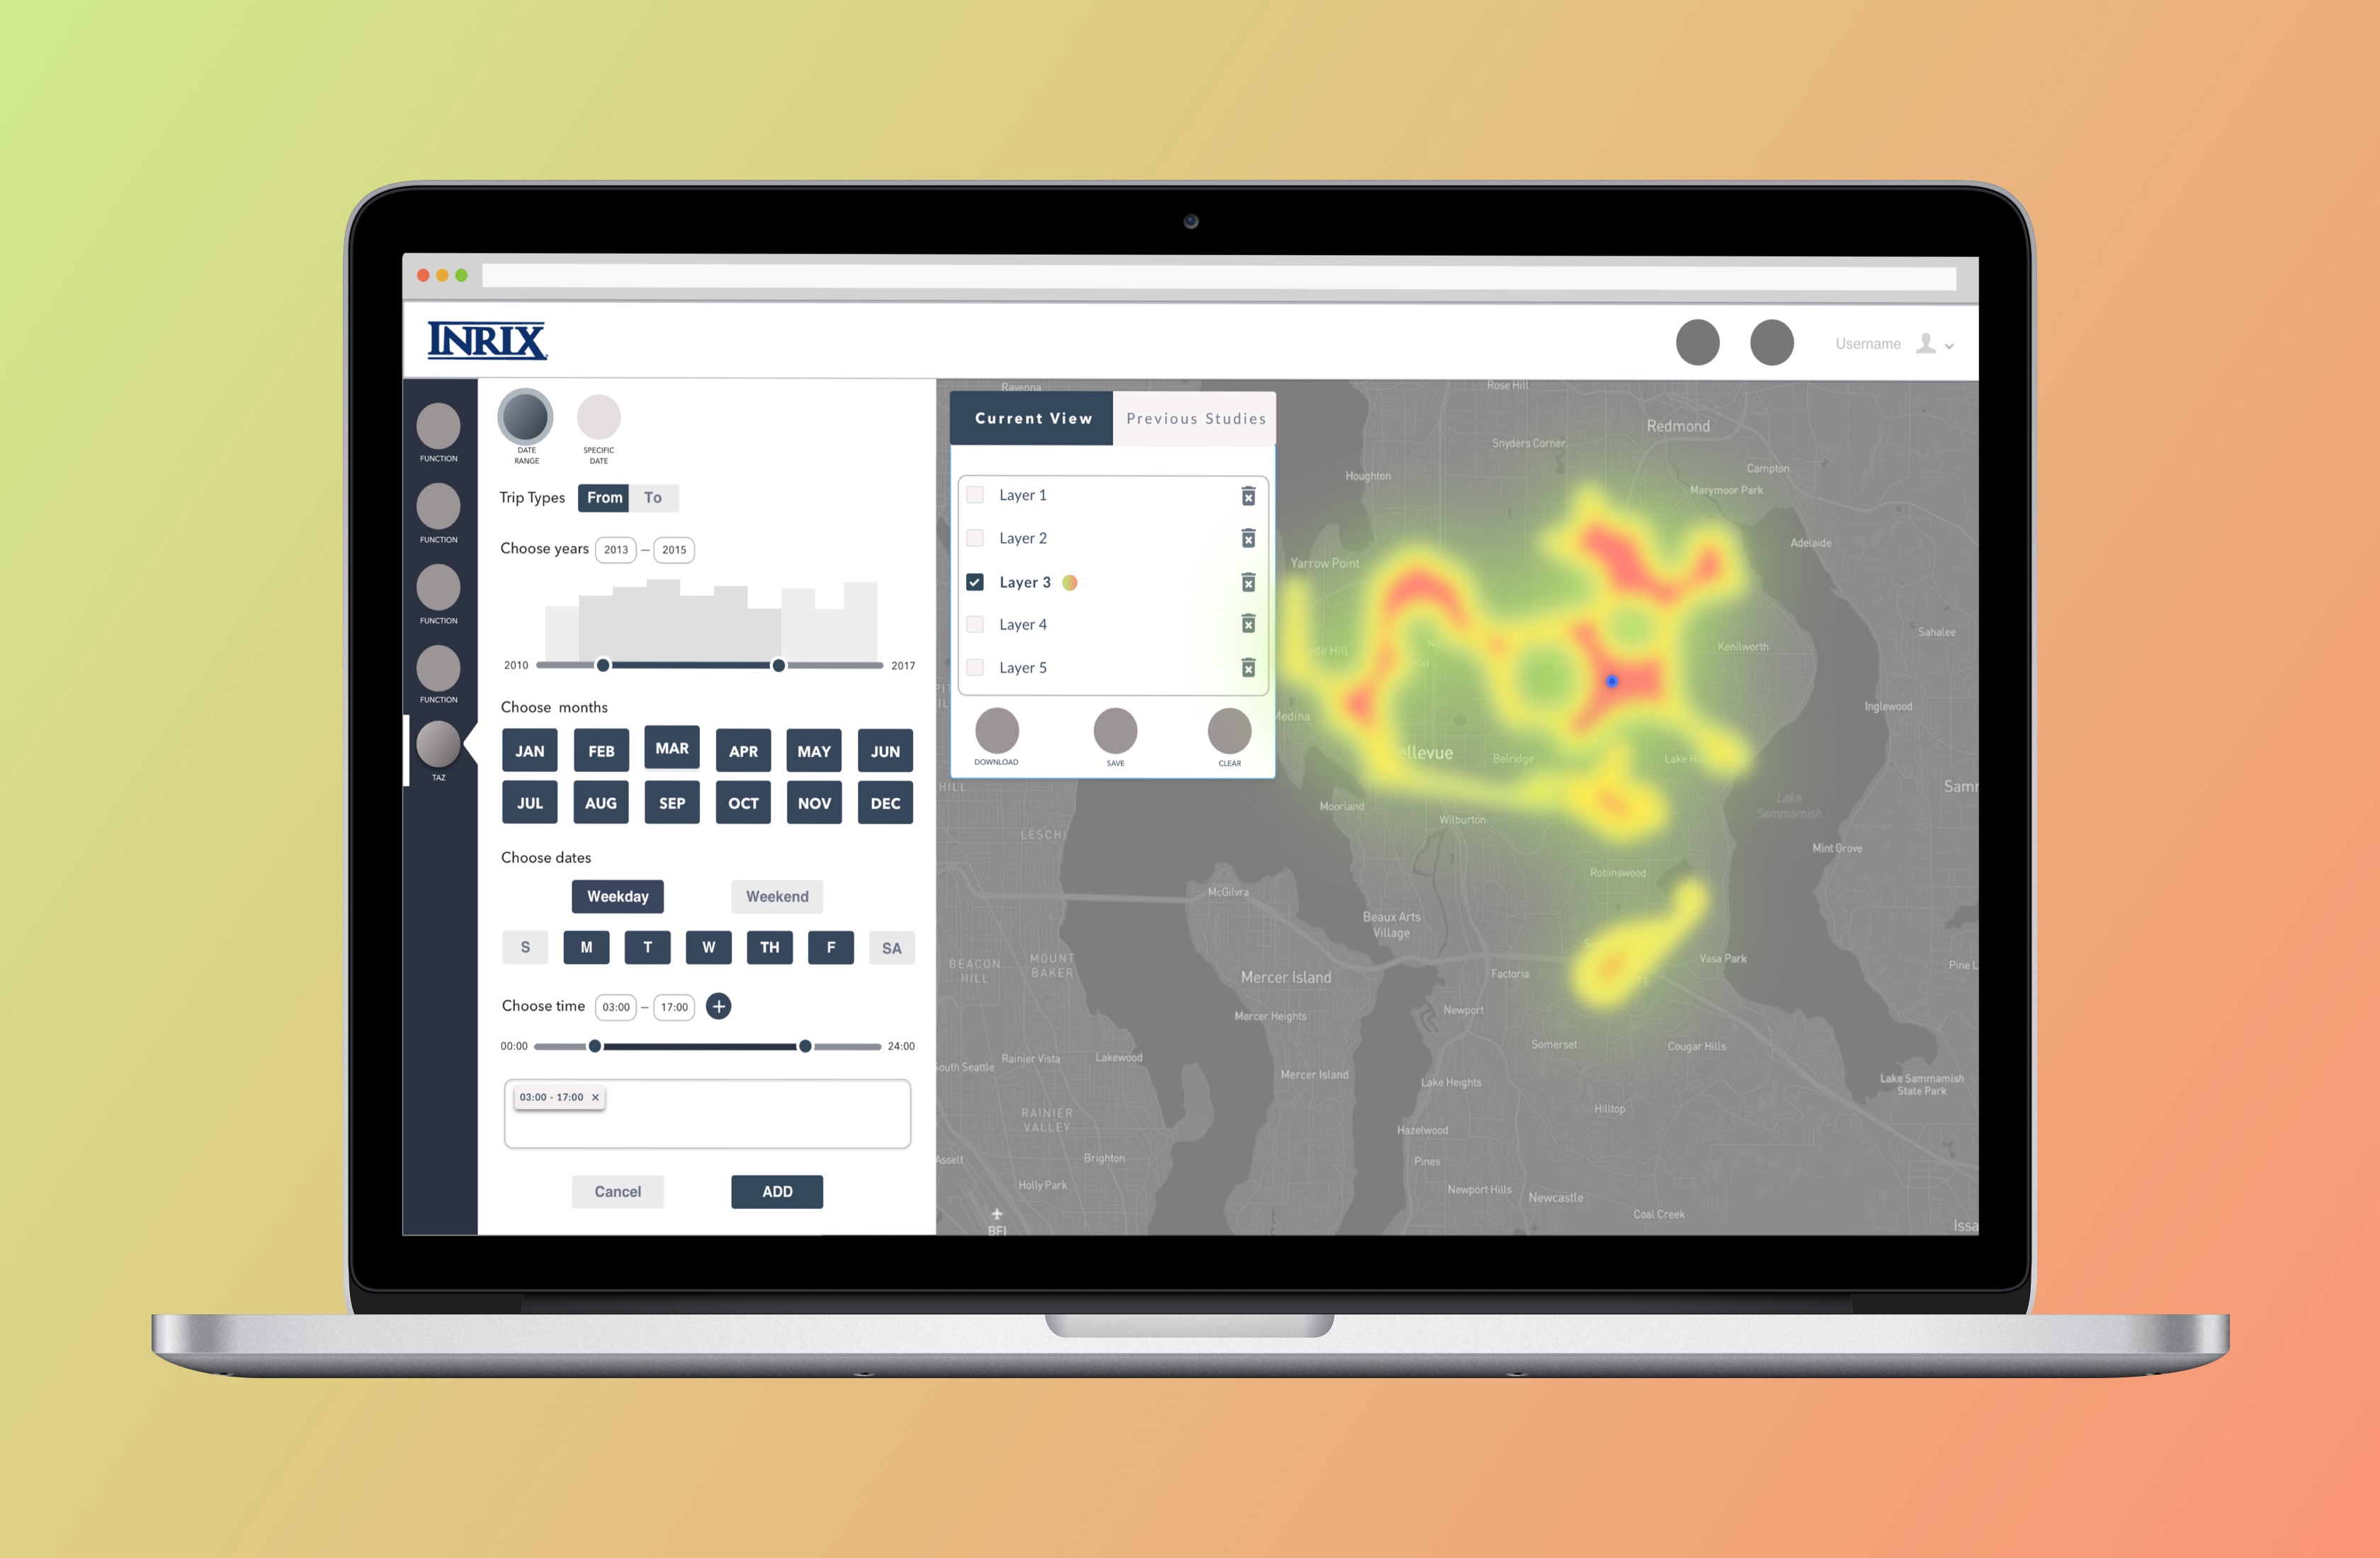
Filter Function
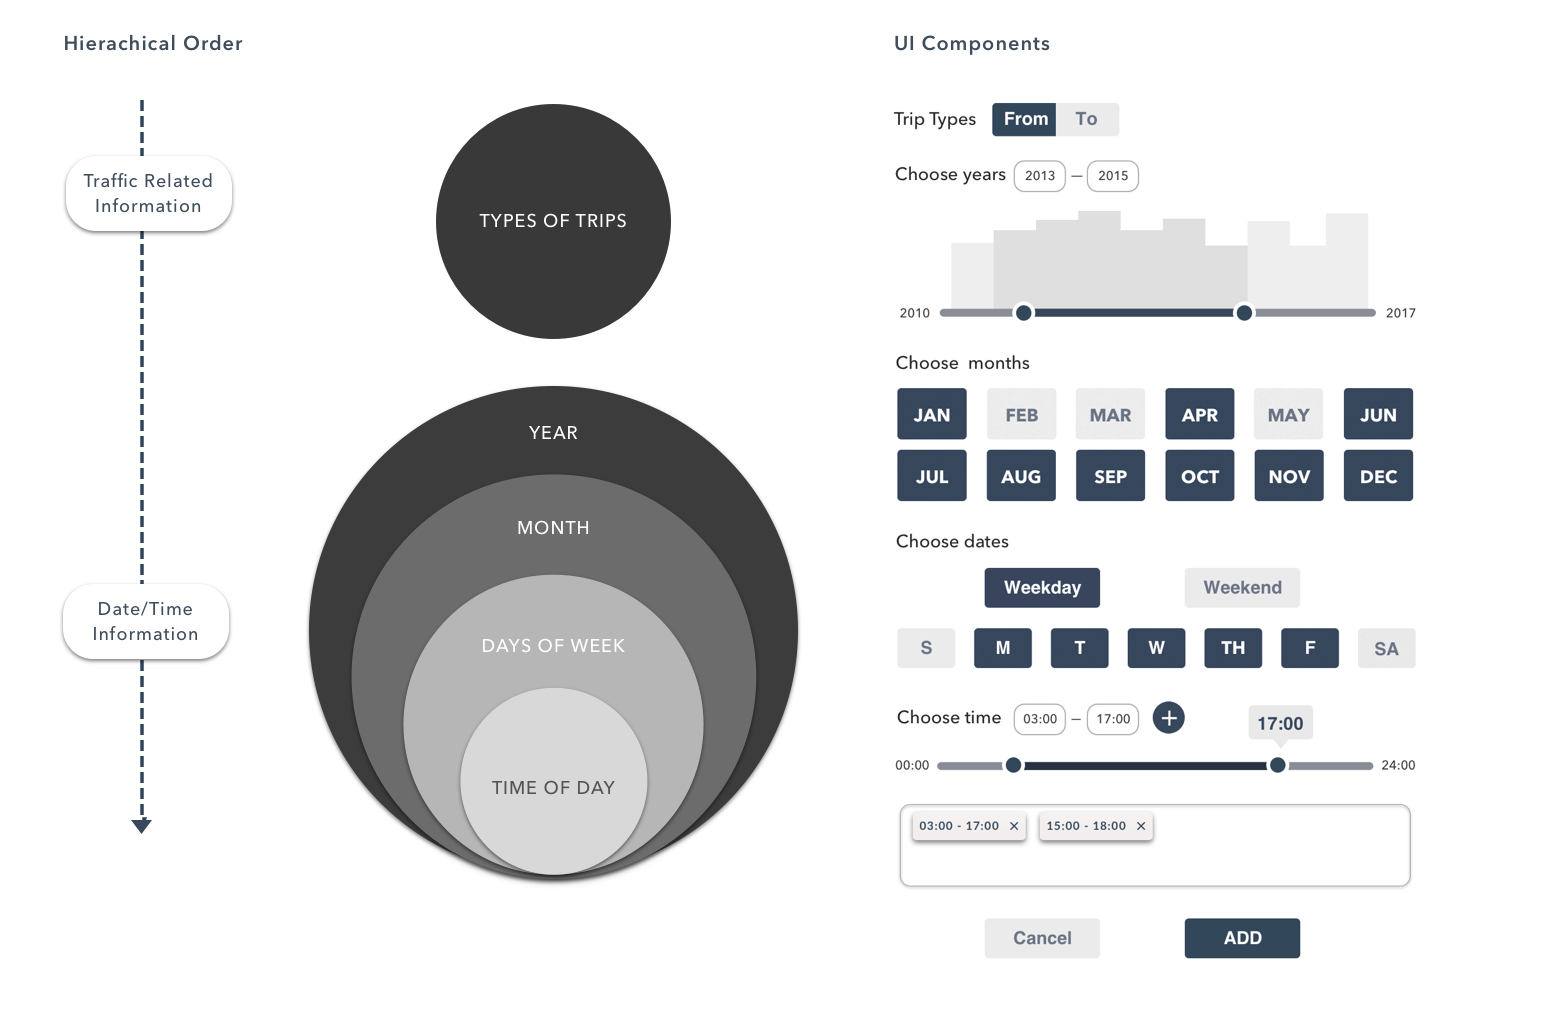
We also would like to provide our users the ability to adjust, simplify, customize, and shape our data to match with their expectation. Based on data from the user research, our customer did not want to have a whole set of traffic data which contained more than millions records of travel journeys and they wanted to filter and scope the data down to specific time and date for their analysis. I decided to add a filter function to assist users with data selection and filtering. So, they could customize and filter the trips dataset by particular year, month, days of week, and time of day. In the design rational for date/time filter function. I decided to use top-down hierarchical order. So, the layout will be consistent and users can follow the sequential order of UI layout from left to right by choosing data filter on the left and interact with the map on the right. The order of the date/time filter goes from the largest time range to the smallest as following year -> month -> days of week -> time of day to help users easily follow the logical and hierarchical order.
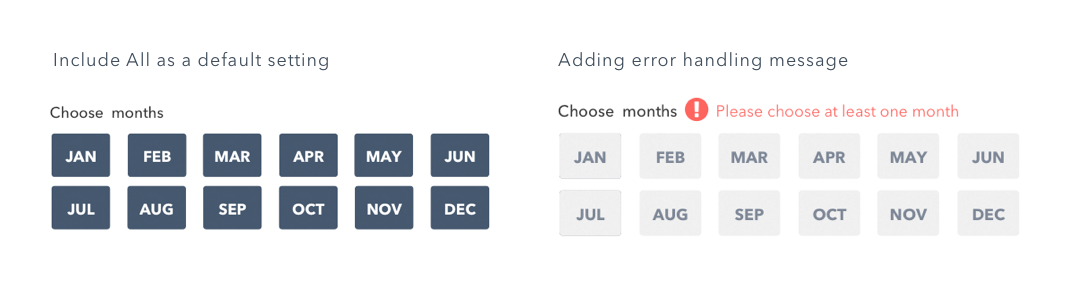
Error prevention
Adding feedback, and default settings
Final Design.
Implementing.
It's time for the implementation! Let's turn our idea into the product! For this step, I used both Javascript (for front-end), Python (for back-end), and PostgraSQL. The framework I used are Meteor.js, Django, Mapbox, and Bootstrap to build a trade area zone web application.

Final Deliverable.
What I learnt from this project.
- Dont execute too fast and jump right into high-fidelity prototyping or implementing especially if you or your manager are not sure about the product direction or features. Try to start with low-fidelity and paper prototype first because it can heuristically provide the conceptual information of the features. So, you and your manager will have a better understanding and clear picture of the product as a whole. Moreover, it can save enormous amount of time if you have to redo or completely change the product direction.
- how to scope down the ideas, features, and also adjust your design in order to make it alines with the company’s identities and the product’s directions.
- I learnt a lot about geo-visualization techniques to understand the strength and weakness of each method.
- This project also gave me a chance about Restful APIs, Meteor framework, and Reactive Model.